|
The usage of our campus Wi-Fi service is having an awesome growth in the past three years. We also got new record device numbers, user counts and current connections in every semester. Our HKUST communities are now enjoying convenient Wi-Fi surfing in almost all campus areas after three years of IEEE 802.11 a/g/n Wi-Fi network deployment by ITSC.
Device Statistics
We had around 10,000 and 23,000 unique devices connected in May 2012 in hostel areas and whole campus respectively. Compared with last year, we got 35% and 40% growth respectively. Figure I below shows the number of unique devices which were connected to the Wi-Fi network in (A) hostel areas, and (B) whole campus each week in academic years 2009 to 2011.
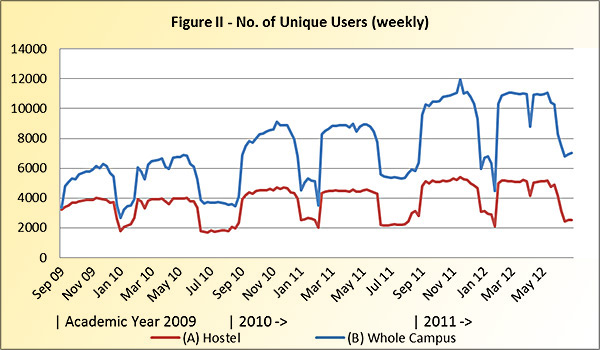
User Statistics
Around 5,200 and 11,000 unique users used Wi-Fi in May 2012 in hostel areas and whole campus. It is amazing that over 85% of our students and staff out of total population of 13,000 users are already utilizing the Wi-Fi services in their daily life. Figure II below shows the number of unique users who used one or more devices to connect to the Wi-Fi network in (A) hostel areas, and (B) whole campus each week in academic years 2009 to 2011.
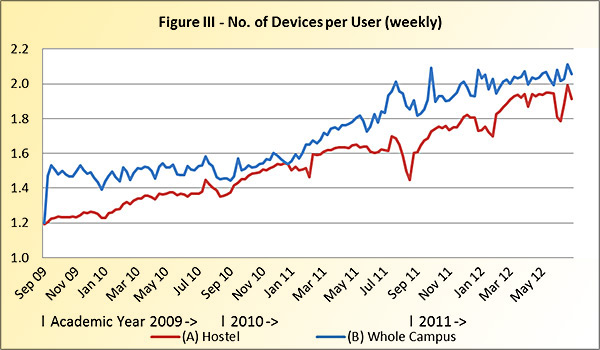
Devices per User Statistics
We observed that all users had 2 Wi-Fi devices on average in last semester. Compared with two years ago, each user then only had 1.4 devices on average. Figure III below shows the average devices connected to the Wi-Fi network per user in (A) hostel areas, and (B) whole campus each week in academic years 2009 to 2012.
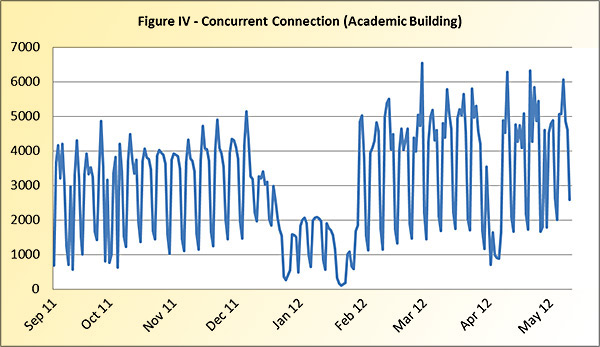
Concurrent Connection Statistics
In the academic building, the Wi-Fi service is serving a peak of 5,800 concurrent devices on average during office hours in April and May 2012. Figure IV below shows the concurrent connection in academic building each day on average in academic year 2011.
In the student hostels, we are serving a peak of 4,800 concurrent devices on average during mid-nights in April and May 2012. Figure V below shows the concurrent connection in student hostels each day on average in academic year 2011.
|