|
Number of Work/Study-Related Injuries
A total of 30 work/study-related injury cases were recorded in 2012. Among the cases:
- 22 cases involved staff members
- 4 cases involved students
- 4 cases involved contractor
A comparison of accident numbers over the past 10 years is shown in Table 1 below.
| Table 1. Comparison of Staff & Student Work/Study-Related Accident Numbers |
| Year |
2003 |
2004 |
2005 |
2006 |
2007 |
2008 |
2009 |
2010 |
2011 |
2012 |
| Staff Accident Number |
23 |
30 |
35 |
25 |
18 |
22 |
27 |
35 |
19 |
22 |
| Student Accident Number |
7 |
6 |
7 |
8 |
8 |
8 |
4 |
8 |
6 |
4 |
Lost Workdays
A total of 432 lost workdays of all the staff injury cases were recorded by the end of 2012. The comparison of lost workdays over the past 10 years is shown in Table 2 below.
| Table 2. Comparison of Lost Workdays |
| Year |
2003 |
2004 |
2005 |
2006 |
2007 |
2008 |
2009 |
2010 |
2011 |
2012 |
| Total Number of Lost Workdays |
382.5 |
123.5 |
278 |
430 |
86 |
140 |
473 |
382 |
143.5 |
432 |
| Average Lost Workday Per Accident |
16.6 |
4.1 |
7.9 |
17.2 |
4.8 |
6.4 |
17.5 |
10.9 |
7.6 |
19.6 |
The severity of individual cases is analyzed and represented by the number of lost workdays as shown in Table 3. In all the 22 staff work-related injury cases, 5 cases did not incur any lost workdays, 2 cases incurred 3 or fewer lost workdays and 15 cases incurred more than 3 lost workdays. The largest number of lost workdays in one single case was 251 days.
| Table 3. HKUST Staff Work Accident in 2012 by Department |
| Department |
No. of Accidents |
| |
Total |
LWD=0 |
0
| LWD>3 |
|
| ECE |
1 |
1 |
|
|
| FMO |
10 |
2 |
2 |
6 |
| FO |
1 |
|
|
1 |
| IENV |
1 |
|
|
1 |
| LIFS |
1 |
1 |
|
|
| SAO |
8 |
1 |
|
7 |
| Total |
22 |
5 |
2 |
15 |
LWD = Lost Workday(s)
Cause of Work/Study-Related Injuries
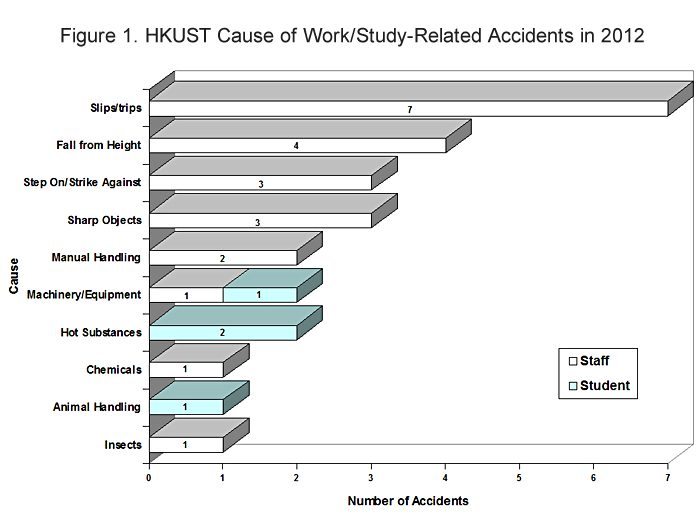
Figure 1 summarizes the causes for all work/study-related injuries in 2012.
"Slips and trips" had become the top cause for work/study-related injuries in 2012, with 7 cases in total. Among the 4 student injury cases, 2 of them were caused by hot substances.
Locations of Accidents
Among the 26 staff and students injury cases:
- 8 occurred in laboratories
- 4 occurred in common areas
- 5 occurred in staff/student quarters
- 4 occurred in workshops/plant rooms/warehouses
- 2 occurred in office areas
- 3 occurred in sport facilities
Common Root Causes of Accidents
Besides classifying causes of injuries in terms of physical sources and energies involved, investigation of the injury cases also revealed some common underlying root causes. These root causes are summarized in Figure 2 below.
.jpg)
Non-Injury Incidents
A total of 3 non-injury incidents were reported in 2012, 2 of which occurred in laboratories and 1 occurred in the NFF facility. The incidents are summarized below by their nature:
- Chemical spill – 1 case
- Failure of centrifuge – 1 case
- Alarm triggered due to gas leakage being detected – 1 case
Students were involved in 2 of the incidents.
Summary of Significant Findings
- The number of staff injury cases had increased by 3 cases (16%), while the number for students had decreased by 2 cases (33%).
- The number of lost workdays in 2012 was 432 days, more than 200% increase in comparison with the previous year. However, such increase was mainly contributed by one single case with 251 lost workdays, about 58% of the total.
- "Slips and Trips" had become the top cause for injuries in 2012 (7 cases). The number of cases caused by "Sharp Objects" had reduced to 3. Although "Sharp Objects" was the top cause and major cause for student injuries in 2011, none of the cases in 2012 involved student. The number of cases caused by "Manual Handling" had also reduced from 5 to 3 cases.
- The number of non-injury incidents had reduced significantly from 10 cases to 3 cases.
- Analysis of the underlying root causes indicated that 50% of all the staff/student accidents were attributed to "negligence", a cause which had only contributed to 24% of total accidents in 2011. About 23% (6 cases) of the causes were attributed to "Inadequate knowledge or skill" and 11% (3 cases) were attributed to "Unsafe practice or Improper Procedure", as compared with 44% and 20% respectively in 2011.
|