|
Number of Work/Study-Related Injuries
A total of 36 work/study-related injury cases were recorded in 2013. Among the cases:
- 27 cases involved staff members
- 5 cases involved students
- 4 case involved contractors
A comparison of accident numbers over the past 10 years is shown in Table 1 below.
| Table 1. Comparison of Staff & Student Work/Study-Related Accident Numbers |
| Year |
2004 |
2005 |
2006 |
2007 |
2008 |
2009 |
2010 |
2011 |
2012 |
2013 |
| Staff Accident Number |
30 |
35 |
25 |
18 |
22 |
27 |
35 |
19 |
22 |
27 |
| Student Accident Number |
6 |
7 |
8 |
8 |
8 |
4 |
8 |
6 |
4 |
5 |
Lost Workdays
A total of 272 lost workdays of all the staff injury cases were recorded by the end of 2013. The comparison of lost workdays over the past 10 years is shown in Table 2 below.
| Table 2. Comparison of Lost Workdays |
| Year |
2004 |
2005 |
2006 |
2007 |
2008 |
2009 |
2010 |
2011 |
2012 |
2013 |
| Total Number of Lost Workdays |
123.5 |
278 |
430 |
86 |
140 |
473 |
382 |
143.5 |
432 |
272 |
| Average Lost Workday Per Accident |
4.1 |
7.9 |
17.2 |
4.8 |
6.4 |
17.5 |
10.9 |
7.6 |
19.6 |
10.1 |
The severity of individual cases is analyzed and represented by the number of lost workdays as shown in Table 3. In all the 27 staff work-related injury cases, 7 cases did not incur any lost workdays, 8 cases incurred 3 or fewer lost workdays and 12 cases incurred more than 3 lost workdays. The largest number of lost workdays in one single case was 137 days.
| Table 3. HKUST Staff Work Accident in 2013 by Department |
| Department |
No. of Accidents |
| |
Total |
LWD=0 |
0
| LWD>3 |
|
| CHEM |
2 |
1 |
|
1 |
| CIVL |
1 |
1 |
|
|
| DST |
1 |
|
|
1 |
| E21 |
1 |
|
1 |
|
| FMO |
10 |
2 |
5 |
3 |
| FO |
1 |
|
|
1 |
| LANG |
1 |
1 |
|
|
| SAO |
10 |
2 |
2 |
6 |
| Total |
27 |
7 |
8 |
12 |
LWD = Lost Workday(s)
Cause of Work/Study-Related Injuries
Figure 1 summarizes the causes for all work/study-related injuries in 2013.
“Manual handling” was the top cause for work/study-related injuries in 2013, with 6 cases in total. Among the 5 student injury cases, 3 of them were caused by sharp objects.
Locations of Accidents
Among the 32 staff and students injury cases:
- 6 occurred in laboratories
- 8 occurred in student quarters
- 5 occurred in staff quarters
- 4 occurred in office areas
- 5 occurred in outdoor common areas
- 2 occurred in workshops
- 2 occurred in sport facilities
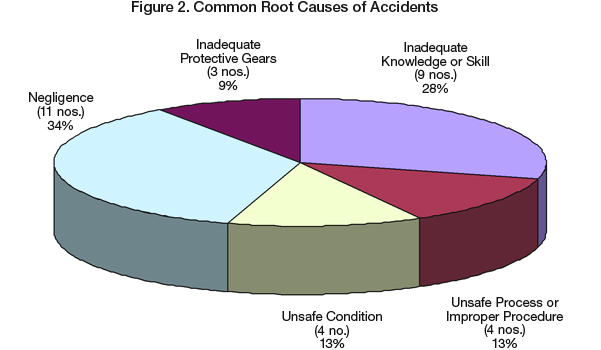
Common Root Causes of Accidents
Besides classifying causes of injuries in terms of physical sources and energies involved, investigation of the injury cases also revealed some common underlying root causes. These root causes are summarized in Figure 2 below.
Non-injury Incidents
A total of 7 non-injury incidents were reported in 2013, 6 of which occurred in laboratories and 1 occurred in the student quarters. The incidents are summarized below by their nature:
- Chemical reactions – 3 cases
- Overheating and fire – 4 cases
Summary of Significant Findings
- The number of staff injury cases had increased by 5 cases, and the number for students had increased by 1 case.
- The number of lost workdays in 2013 was 272 days, 37% less than the previous year.
- Among the 27 staff injury cases, 7 cases did not incur any loss workdays, 8 cases had resulted in 3 or fewer lost workdays, 12 cases had resulted in over 3 lost workdays.
- “Manual Handling” had become the top cause for injuries in 2013 (6 cases). Among the 5 student injury cases, 3 of them were caused by sharp objects.
- The root causes of the accidents, in the descending order of occurrence frequency, were “negligence” (34%), “inadequate knowledge or skill” (28%), “unsafe process or improper procedure” (13%), “unsafe condition” (13%), and “inadequate protective gear” (9%).
|